Infographics, checked against the source
Infographics from your PDF. Every number checked.
For analysts, consultants and nonprofit comms leads: FactFrame turns your report into a one-page infographic plus a fact receipt that ties every number on it to its source page, so you can publish without a designer's day or a proof-reader's pass.
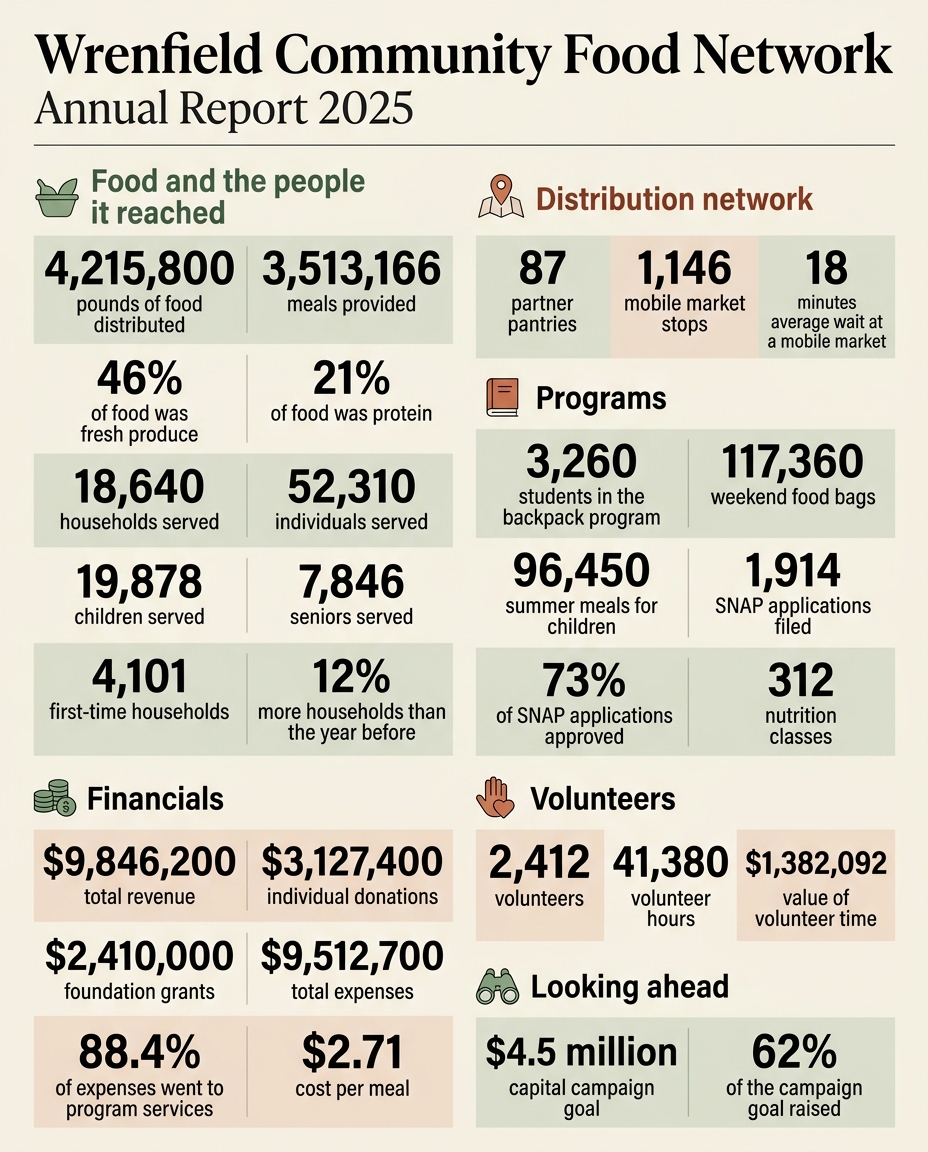
The newest run at 2.1's cheapest setting (1K · minimal thinking · 4:5), on an invented nonprofit's report. First check: 31 of 31, nothing else on the image. Ended 31 of 31, all clear. Not every cheap run is this clean: see the record below. See a repair, step by step
Image models can lay out a whole infographic in one call, but they still get numbers wrong, and a model asked to read the image back forgives broken digits.
FactFrame renders from facts it found verbatim in your PDF, reads every number back blind, matches it to its page, and repairs only what's wrong.
You publish with a receipt you can show a board, a funder or an editor, including what could not be verified. “Nothing wrong” is a claim only a receipt can make.
Upload a PDF, pick the facts, download the PNG and its receipt.
I · The problem
“Looks right” is not a check.
A wrong figure in a published graphic costs the publisher's credibility, and the usual readers of an image let it through.
Image models can now lay out a whole infographic, dense text and all, in one call. They are good at it: in 3 live runs of the 31-fact report in this demo at 2K, Nano Banana 2.1 drew every number right on the first render in 3 (one of them checked by the first engine's weaker gate); the receipt below is one of them. But “usually right” can't be published on trust, and nothing on the image tells you which run was the lucky one.
The obvious safeguard has a blind spot. A vision model asked to read an image back forgives digits that are drawn broken, so a second model glancing at the first one's work is not a check either. Today the fix is a designer's day plus a proof-reader's pass over every figure, every time the graphic changes.
In my own test of Nano Banana 2.1 (released 2026-10-06), a vision reader returned a shop sign's text exactly, although its letters were drawn broken.
II · The solution
Render, read twice, match, repair.
Every number is traced to its page and checked by a reader that has to pass its own controls first. The full method
- 1
Ingest
Every number in your PDF, with its page and the exact sentence or table row it sits in.
- 2
Pick
Choose the facts to feature and their captions. A number that isn't in the PDF verbatim is refused, not fixed.
- 3
Render
Nano Banana 2.1 draws the infographic from that exact list, at 2K, with thinking left on.
- 4
Read twice
A blind reader transcribes every number twice; any disagreement gets a third read and the majority.
- 5
Match
Each number is matched to its source by one rule: separators are formatting, nothing is ever rounded.
- 6
Strict check
A second prompt looks for damaged digits, and is trusted only after it catches a damaged-digit control.
- 7
Repair
A wrong number gets a masked edit of just its region, then a re-read. At most three rounds.
- 8
Receipt
The PNG plus a receipt: every number, its page, its status, the controls, and what couldn't be verified.
III · Why it matters
The receipt is the product.
The repair loop is the safety net. The receipt is what you hand over: every number, the sentence and page it came from, its status, and the list of what could not be verified.
Fact receipt · rcpt_280e2bc627b2 · replay of a live run
Wrenfield Community Food Network: Annual Report 2025
31of 31
| On the image | Source in the PDF | Page | Status | Rounds |
|---|---|---|---|---|
| 2025 Annual Report | “Annual Report 2025 · Fiscal year July 1, 2024 to June 30, 2025” | p. 1 | Match | 0 |
| 4,215,800 pounds of food distributed | “Total food distributed 4,215,800 pounds” | p. 2 | Match | 0 |
| 3,513,166 meals provided | “Meals provided (1.2 pounds per meal) 3,513,166 meals” | p. 2 | Match | 0 |
| 46% of food was fresh produce | “Share that was fresh produce 46%” | p. 2 | Match | 0 |
| 21% of food was protein | “Share that was protein (meat, dairy, eggs) 21%” | p. 2 | Match | 0 |
| 18,640 households served | “Households served 18,640 households” | p. 2 | Match | 0 |
…and 25 more numbers in the full receipt.
A real receipt (2K · thinking on · 4:5, engine 2026-10-06.6): 31 of 31 on the first render, 31 of 31 final. Open the full receipt
For the board
Every figure on the one-pager points to its page in the annual report.
For the funder
Numbers that drift between drafts are caught, not discovered after the grant report goes out.
For the editor
The receipt says what was checked, how, and what wasn't: no claim it can't back.
IV · Measured, not estimated
The cheaper setting needs the check.
Costs below are medians of real calls in the ledger, priced from each call's own token counts.
Render · 2K, thinking on
$0.073
product setting, per image
Render · 1K, minimal
$0.049
draft setting, per image
One blind read
$0.0027
two per check, a third on disagreement
Live runs so far
18
13 ended all clear (6 on the first engine's weaker gate); on the current gate, 7 of 11; 1 interrupted
At the draft setting, 4 of 7 runs of the 31-fact report had a problem on the first check (numbers drawn twice, a missing figure, a figure without its caption), and 5 of 7 ended all clear. One ended short with the problem flagged for a person. One was first reported all clear by an earlier caption rule and has been corrected on its receipt.Every live run is listed with its setting and engine on Evals.
V · How it's used
Four steps, one receipt.
Upload the PDF
FactFrame lists every number with its page and source sentence.
Pick the facts and captions
Captions can't carry digits: every number on the page is a checked fact.
Let it render, read, match and repair
Up to three rounds of masked edits; anything still wrong is flagged for you.
Download the PNG and the fact receipt
PDF for the board pack, JSON for your records.
Who it's for
- Nonprofit comms leadsAnnual-report one-pagers shown to boards and funders, with the receipt to back them.
- ConsultantsClient-ready visuals from a survey or a model, where one wrong figure undoes the deck.
- AnalystsResearch summaries that get quoted, so every number needs a page reference.
Read the Wrenfield story (an invented nonprofit, real runs).
VI · Pricing
Priced per verified infographic.
Pricing preview: billing is not live
Pay as you go
$6per verified infographic
One infographic and its fact receipt.
Team
$149per month
40 verified infographics included.
Try it
Bring a PDF. Publish the numbers with their receipt.
Watch a real run: every number read back, the wrong ones caught and repaired, all of it written into a receipt.
Try the demoEarly access
Turn a report into an infographic you can trace back to the PDF.
Send me a public report. I’ll run it through FactFrame and return the infographic plus a receipt showing where each number came from and what could not be verified.
Early users get
- A real FactFrame run on your report
- The finished PNG
- The fact receipt, with the source sentence and page for each number
- A clear record of anything FactFrame could not verify
What it checks: the numbers on the image (amounts, percentages, years, dates and times) against your PDF. Not units of measure, and not the wording around them.
Request an early-access run: the link is in the post; the request form opens here soon.
Free while billing isn’t live. No account or payment. Public reports only for now. I’m opening a small number of runs at a time.